Akuity's DORA Metrics Dashboard: Built-In, No Setup Required
Alexander Matyushentsev


Published by Alexander Matyushentsev in 2024. Updated in September 2026 by Carolyn King.
How quickly and reliably a team ships software directly affects how fast a business can respond to its customers and its market. That combination of speed and reliability is what software delivery performance measures, and it's only as clear as the data behind it.
As VentureBeat reported from VB Transform 2026, Zillow's SVP of Engineering credited the company's ability to attribute a 40% increase in shipped code to AI adoption to a DORA metrics baseline the team had built years before the AI rollout began. Without that baseline already in place, there would have been no way to make that claim credibly.
DORA metrics, the DevOps industry standard for measuring software delivery speed and stability, require pulling data from multiple sources: git, CI/CD, incident tools, and project trackers. Most teams have to stitch that data together themselves, or rely on a separate platform that does it for them.
The Akuity Platform manages deployment and promotion natively, which gives it direct access to the data behind software delivery performance, so teams using Kargo on the Akuity Platform get metrics from day one with no setup required. Akuity's DORA Metrics Dashboard shows exactly where a team's delivery process has room to improve, whether that's release frequency, lead times, failure rates, or recovery speed.
Kubernetes, GitOps, and Software Delivery Performance
Kubernetes gives application developers more direct control over how software ships. It breaks down the barrier between developers and operations teams, giving developers the ability to make infrastructure changes without depending on an operations team, adopt advanced rollout strategies, and deliver value to end users faster. This shift toward developers owning infrastructure and delivery, not just code, is at the center of modern DevOps practice.
GitOps tools like Argo CD implement an opinionated way of managing Kubernetes resources, so a cluster’s live state matches what is in Git. Tools like Kargo extend that same GitOps approach to promotion, managing how changes move across environments once they're deployed. Together, Kubernetes and GitOps tools for deployment and promotion give teams more control over how software ships. The open question: how does a team know whether that shift is actually translating into better software delivery performance?
DORA metrics answer that question, and the next section breaks down exactly what they measure.
What Are DORA Metrics?
DORA metrics give teams an objective way to measure software delivery and operational performance. Four metrics make up that framework:
Deployment Frequency: how often a team releases to production.
Lead Time for Changes: the time it takes for a commit to reach production.
Change Failure Rate: the percentage of changes that cause a failure in production.
Mean Time to Recovery (MTTR): the time it takes to recover from a failure in production.
Deployment frequency and lead time for changes measure velocity: how quickly new features, fixes, and updates reach the people using them. Change failure rate and MTTR measure stability: how much that speed costs in outages, rollbacks, and firefighting. Engineering leaders use these numbers to see whether a team can ship new applications quickly and keep them running once they're live.
In 2024, DORA added a fifth metric: deployment rework rate, the share of deployments that are unplanned work to fix bugs. Two earlier changes are widely misreported: reliability was never a delivery metric, despite the 2021 report calling it one, and MTTR was renamed failed deployment recovery time in 2023. The original four remain the most widely tracked and are part of Akuity’s DORA dashboard.
How Do Teams Capture DORA Metrics?
Teams take one of a few approaches to capturing DORA metrics, each with different tradeoffs in effort and completeness. Many skip it entirely: correlating data across git, CI/CD, and incident tools by hand is enough of a barrier that teams often forgo the visibility they'd want.
Table: 4 Ways Teams Capture DORA Metrics
Approach | How it works | What it requires |
|---|---|---|
Manual / DIY | Pull data from git, CI/CD, incident tools, and project trackers, then calculate metrics by hand | Ongoing engineering time to build and maintain |
Engineering intelligence platforms | Aggregate DORA data by integrating across a team’s existing toolchain | Integrations with git, CI/CD, incident, and PM tools, kept up to date |
CD-native dashboards | Built into a CI/CD platform, usually requiring manual configuration per metric | Query and tile setup, plus a separate higher-tier product for visibility beyond that one tool’s pipeline |
Platforms that manage deployment and promotion natively | Deployment and promotion both run through the same platform, so DORA data is a byproduct of the platform’s normal operation | Nothing extra: the data already exists. |
How the Akuity Platform Captures DORA Metrics Natively
Akuity provides enterprise-ready delivery, continuous promotion, and AI-powered intelligence to modernize application delivery. Built by the original creators of Argo CD and Kargo, the Akuity Platform gives teams a complete view of the software delivery process, from the moment a change is deployed to the moment it's promoted across environments.
That means the deployment frequency, lead time, change failure rate, and recovery time data that make up the core DORA metrics come directly from the platform, not a separate integration layer.
How Argo CD and Kargo Capture Deployment and Promotion Data
Without a platform that manages both deployment and promotion, teams typically have to piece this data together from separate tools: a CI/CD system for deployment history, a release management tool for promotion tracking, and often a manual process to connect the two. Argo CD and Kargo remove that gap by handling deployment and promotion as part of the same GitOps workflow.
Keeping a cluster's live state in sync with what's declared in Git is where that process starts: deployment. Argo CD, a GitOps continuous delivery tool for Kubernetes, watches a Git repository for the desired state of an application and continuously syncs that state to a cluster, detecting drift and reconciling it automatically. This gives teams a declarative, auditable record of what's running in production at any point in time.
Moving deployment artifacts across environments safely is the next step: promotion. Kargo, a GitOps continuous promotion tool for Kubernetes, tracks the lifecycle of each artifact from detection through verification, capturing the context a single deployment can't: which environment an artifact is in, how it got there, and whether it passed verification along the way.
A single deployment tells the story of one service at one point in time. Promotion across environments tells the story of how that service moves from commit to production, and how it recovers when something breaks. Because the same platform handles both, teams get the complete deployment record the four DORA metrics require, without piecing it together themselves.
Inside Akuity’s DORA Metrics Dashboard
The DORA Metrics Dashboard lives in the Akuity Platform portal, within the Kargo Metrics dashboard. Argo CD and Kargo already power deployment and promotion, capturing the release, lead time, failure, and recovery data the four DORA metrics are built from. No additional configuration is required: teams using Kargo get the dashboard by default. There's no dashboard to build and no queries to configure: the four metrics appear automatically, without needing to define custom aggregation periods or manually create and save each metric as a tile.
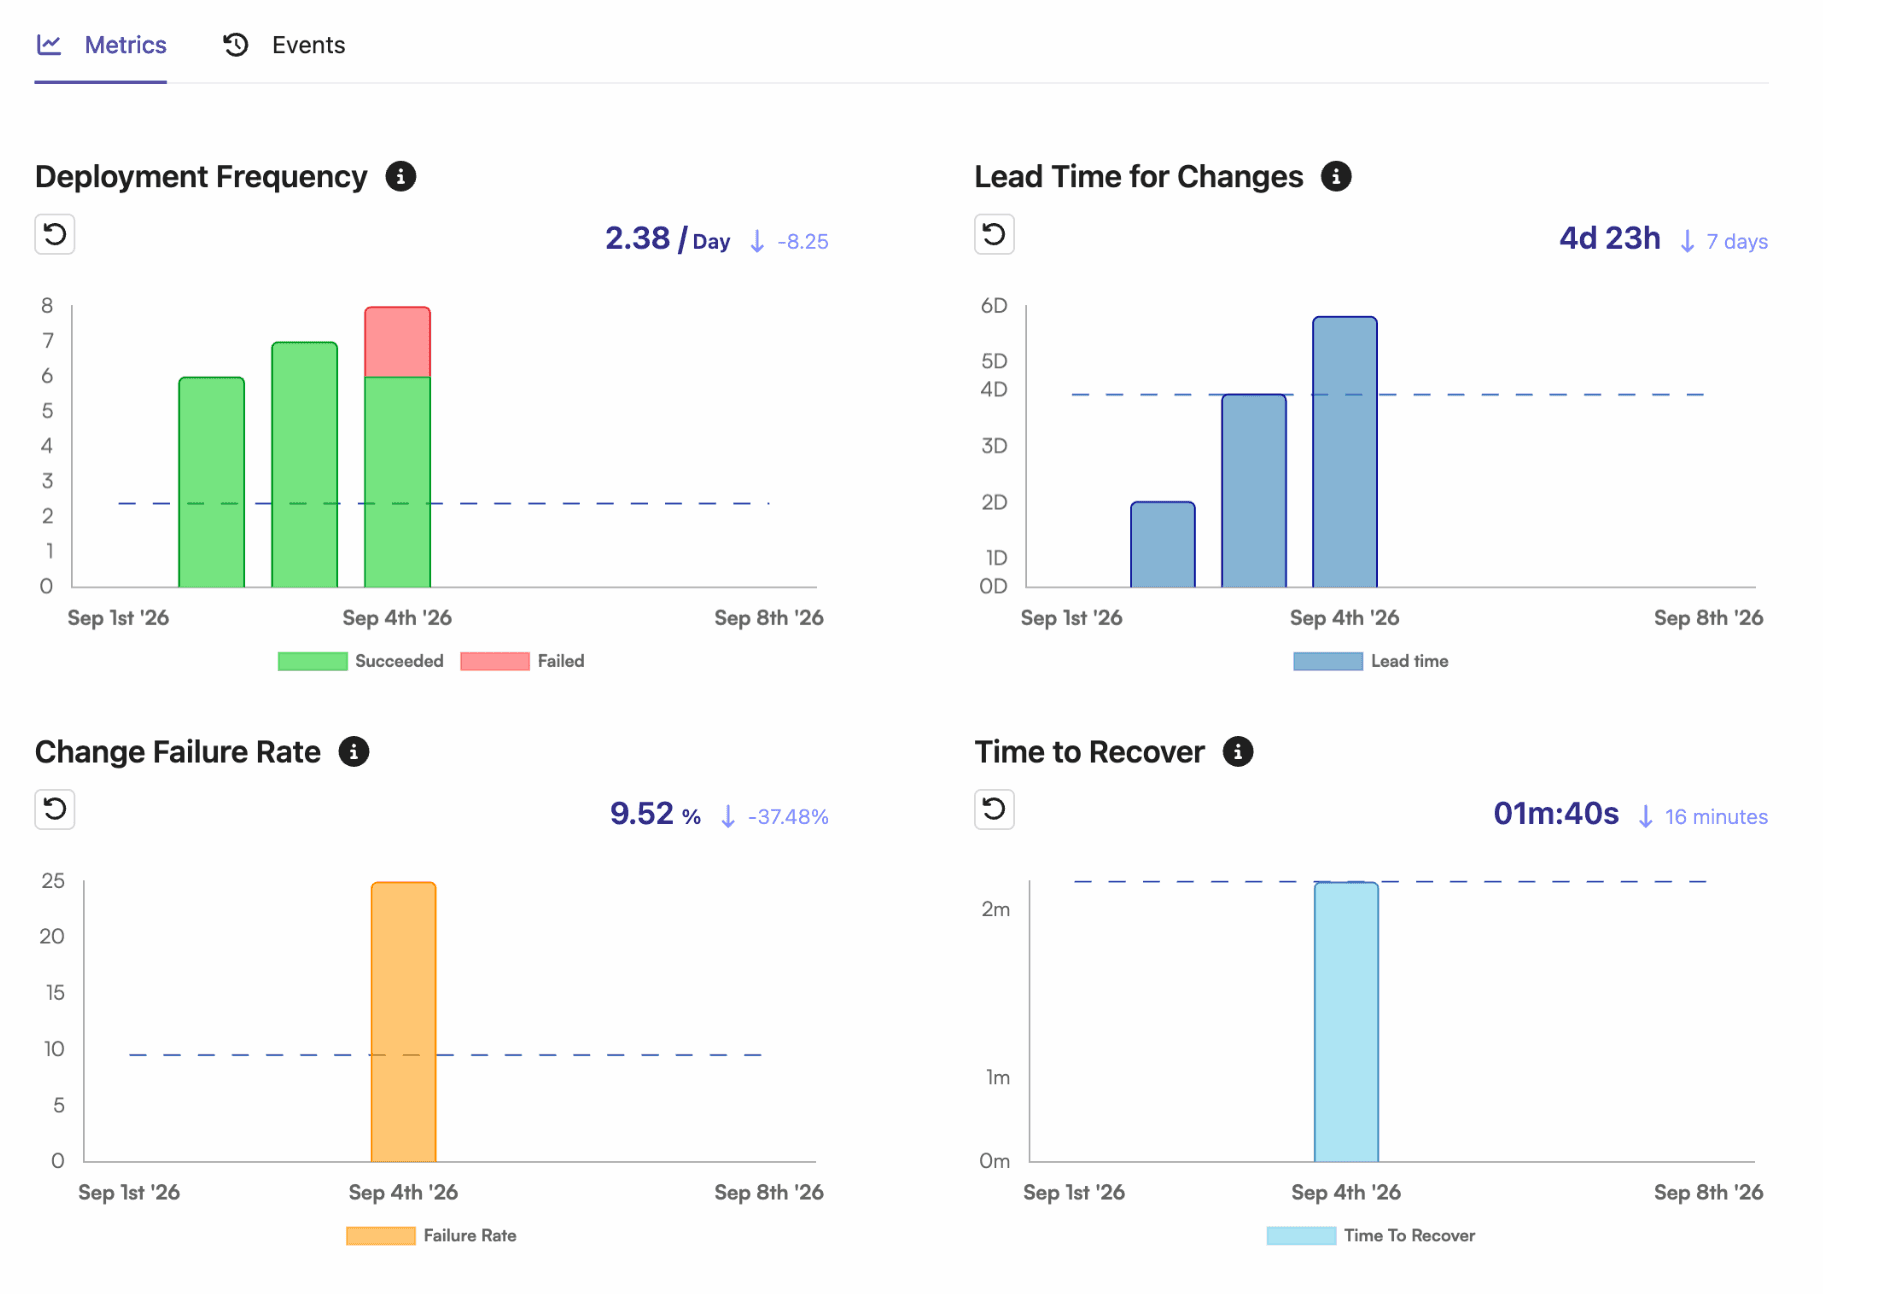
Figure: Akuity Platform’s DORA Metrics Dashboard
The dashboard supports a range of filters to narrow down the data:
Stage: analyze specific stages, which usually map to environments (for example, Development, Staging, Production).
Project: focus on specific projects.
Interval: set the time range, by day or week. Unlike the filters above, it doesn't narrow down which data is included; it changes how the filtered data is visualized.
Initiator: filter by the user who triggered the promotion.

Figure: Akuity Platform Dashboards Filters
The Initiator filter helps identify who to loop in on a stalled or failed promotion, not for evaluating individual performance. DORA's own research is explicit that these metrics reflect team and system capabilities, and using them to assess individuals tends to encourage gaming rather than genuine improvement.
Alongside the DORA charts, an Events tab shows detailed promotion events for the selected stages, including successful promotions, failed promotions, and recovery actions. This gives teams the context behind the metrics: patterns and trends in the delivery process, not just the top-line numbers.
Better Delivery Starts with DORA Metrics Visibility
Teams can't improve a process they can't see, and DORA metrics give engineering teams a shared, objective way to measure how software actually moves from commit to production. Deployment shows what's running in production right now. Promotion shows how it got there, across environments, and how quickly the team recovered if something went wrong. Together, they give DORA metrics the context they're built to measure.
The DORA Metrics Dashboard in the Akuity Platform gives teams a way to measure delivery performance and find room to improve it, without stitching data together from separate systems, integrations, or vendors. Start a free trial to see it on a Kargo instance or book a demo with an Akuity engineer.
Further Reading and Resources
[Blog Post] Argo CD Architectures Explained: Single vs. Per-Cluster vs. Hybrid
[Ebook] Kargo in Action: the book by Ken Cochrane, Jesse Suen, and Kent Rancourt, in early access
[Blog] Continuous Promotion with Kargo: a complete guide to continuous promotion
[Documentation] Kargo Quickstart: build a Warehouse and Stage on a local cluster and promote a first change
Frequently Asked Questions
What are DORA metrics used for?
DORA metrics measure how effectively a team delivers software: how often it ships, how long changes take to reach production, how often changes fail, and how quickly the team recovers when something breaks. Teams use them to identify bottlenecks and track improvement over time, not to rank individual developers.
What is Deployment Frequency?
Deployment frequency measures how often a team releases changes to production. Higher deployment frequency generally reflects smaller, safer changes and a more mature delivery process.
What is Change Failure Rate?
Change failure rate measures the percentage of deployments that cause a failure in production, such as an outage, a rollback, or a degraded service. Lower change failure rate reflects a more stable delivery process.
Does the Akuity Platform require extra setup to track DORA metrics?
No. The Akuity Platform manages both deployment and promotion natively, so the DORA Metrics Dashboard is available by default on any managed Kargo instance, with no separate integration or data pipeline required.
Which DORA metrics does the Akuity dashboard show?
The Kargo dashboard shows four DORA metrics: Deployment Frequency, Lead Time for Changes, Change Failure Rate, and Mean Time to Recovery (MTTR).
Can Akuity’s DORA metrics be filtered by team, project, or environment?
Yes. The dashboard supports filtering by Stage (for example, Development, Staging, Production), Project, and Initiator.
Should DORA metrics be used to evaluate individual developers?
No. DORA's own research is explicit that these metrics reflect team and system capabilities. Using them to assess individuals tends to encourage gaming rather than genuine improvement.
How is this different from stitching DORA data together manually or through another vendor?
Most teams have to pull data from git, CI/CD, incident tools, and project trackers, either themselves or through a separate platform. Because Argo CD and Kargo already manage deployment and promotion, that data comes directly from the platform itself.
